When it comes to data I seem to find people fall on a spectrum that goes from fear/hatred to indifference to curiosity. It is not surprising that a lot of people are plain indifferent to data. They are much more comfortable making decisions based on intuition and half-hearted analysis.
Then there is a group that has no choice but have to work with data and they are either scared of data (they hide behind the 'I'm not really good with data') or hate their work because it involves data.
The last category are the ones that proudly call themselves as data geeks. They thrive with data.
This post is targeted more towards the first group - the ones that hate / fear data.
How much of that fear / hate is brought about by the technology they use? I had done a post a couple months ago about how, when you give an expert the wrong technologies they become average and when you give the average person the right technology they become an expert. What I've figured out over the last couple months, is that when you give an average person the wrong technology you create fear / hatred.
I was with a customer the other day and they were gushing about the undo button in Tableau. All along, I knew it was cool having an undo button but what struck me was that this customer actually went from fear of working with data to joy because of this one little button. They went from one end of the spectrum to the other.
They talked about how before Tableau, if they made a mistake in building out their dashboard, they had to start from scratch. So over time, the product they used had trained them to be scared and killed all curiosity. They never deviated from the exact same steps every time. There would be times they wanted to experiment a bit but the thought of having to start from scratch, killed that thought.
Now with Tableau, they feel freed. They can experiment with their data, be curious, go down various paths of analysis and if they don't like something they just keep hitting the undo button till they come back to a state they were happy with.
Who knew that the little undo button could move someone from fear to curiosity..
Saturday, December 14, 2013
Saturday, November 9, 2013
Tableau Dashboards on iPad - Embedded Javascript to get scrollbars
The iPad (iOS) does not support iFRAMES. So if you have a website where you've embedded a Tableau dashboard in an iFRAME (see my previous post), when you look at it on an iPad, it will be expanded to fit the entire width of the dashboard. Your height / width parameters in the iFRAME will be ignored. If you are ok, with your dashboard being expanded (no scrollbars around the iFRAME) then you are good.
Just to be clear, this has nothing to do with Tableau. This will happen with any iFRAME webpage.
There are cases where you want to keep it to a certain height and width. This post shows how you can do that, but you cannot use an iFRAME. You will have to take the SCRIPT tag that Tableau generates and embed it into the code of your webpage.
What you need to do is after the <SCRIPT> </SCRIPT> tag entry add the following div tag -
<div id="wrapper" style="-webkit-overflow-scrolling: touch; height: 100%; overflow: auto; width: 100%;">
then at the end of all the Tableau generated div, put your closing </div> tag.
This will now allow you to keep your dashboard within a certain height / width and you will get scroll bars on your iPad. Test this viz out to see how it looks on an iPad. I specifically created a really bad dashboard that has multiple scrollbars within the dashboard and really long and wide, so you can see the scrollbars.
btw. the scrollbars inside the dashboard work even when you have an iFRAME.
Tableau Dashboards on an iPad - Using iFRAMES
The iPad (iOS) does not support iFRAMEs. So if you have a Tableau Viz in an iFRAME on your website and you view it on an iPad, you will see that your height and width are ignored and the dashboard is expanded to take over the entire screen. You can view it on a browser on your computer to see the difference. On your computer, the dashboard is kept within the height and width and you get the vertical and horizontal scrollbars. On an iPad it gets expanded. That being said, any scrollbars within the dashboard are still scrollable on the iPad.
Just to be clear, this has nothing to do with Tableau. This will happen with any iFRAME webpage.
In the example below, I set the height and width of the iFrame to 400 / 400, to exaggerate the effect. This is a really bad dashboard from a view-ability standpoint, but it is useful to get the point across. When you view this on an iPad, it starts out as 400 x 400 but when it finishes rendering it gets blown up to fit the entire visualization.
Sunday, October 20, 2013
Tableau - The Jetsons Spacecar of BI Tools - Infographic
I had written a blog post some time back about how I considered Tableau to be the Jetsons Spacecar of BI tools. I was never really happy with how verbose it was and how long it took in words to get my point across. Been thinking about "visualizing" it. You know the saying - A picture paints a thousand words and in line with what Tableau stands for - A visual representation of your data leads to faster insights. So here is my attempt to create an infographic. I'll let you decide which is better..

Wednesday, October 16, 2013
Vacation anyone?
I was looking at a graphic that had details on all the top airlines, airports and routes flown to in 2012. It was quite interesting. One of the things that stood out was that Denver airport, was in the top 5 on all 3 categories - Distance flown, Passengers and destinations flown to. Then again, considering that it is centrally located, it does make sense. The New York airports were conspicuous in their absence, but considering that there are 3 airports to choose from, cannibalization explains that anomaly. Another interesting tidbit, if we look at which airlines are flying out of the top airport (by # of unique destinations), SkyWest Airlines stands out. Who knew it would be in the top 5 for each of the 5 airports. Maybe because it is a regional carrier, it covers a lot of local routes. That is something worth looking into though.
So all this looking at flight data (see below for the visual)
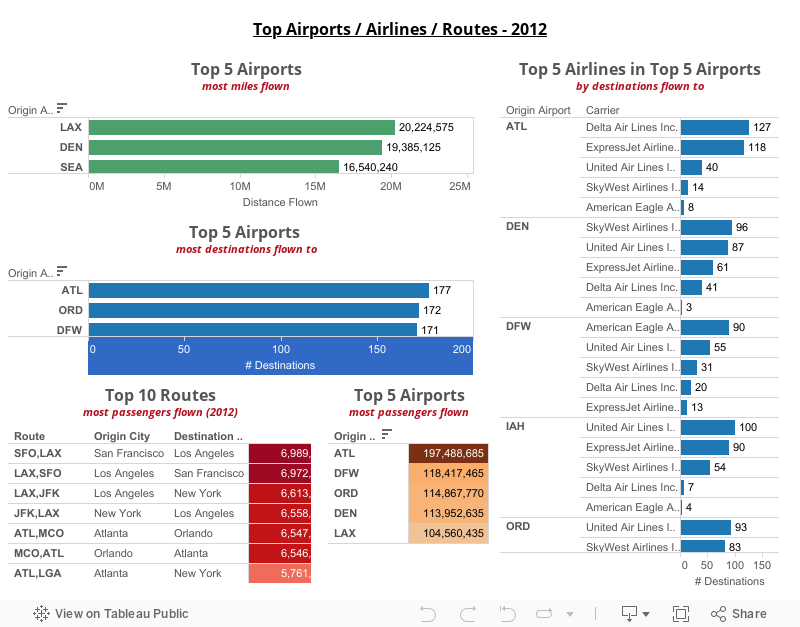 got me thinking about going on vacation.
Which brought on new questions - So what are the top places people are flying to, what airlines fly into those places and which of the airlines are the most punctual.
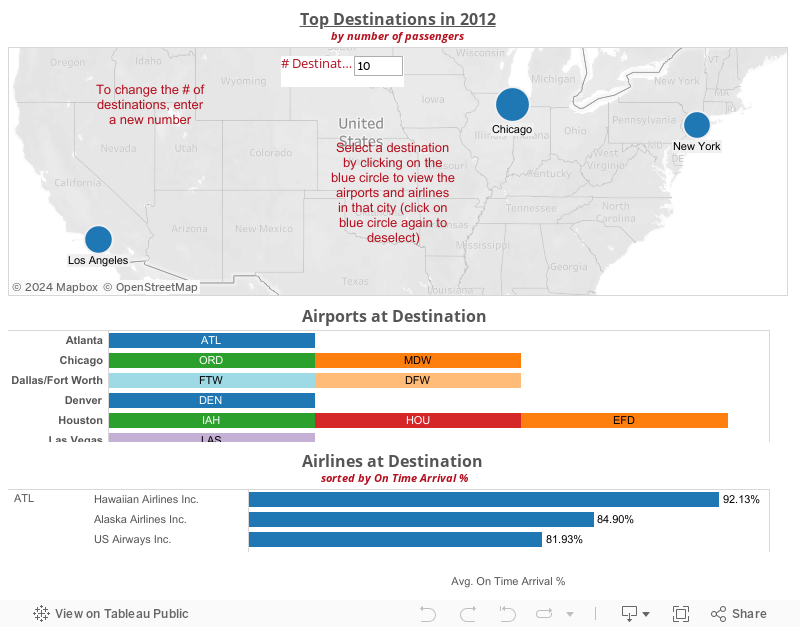
once I narrowed down to an airline, I was really curious on what the top 3 routes flown by that airline was
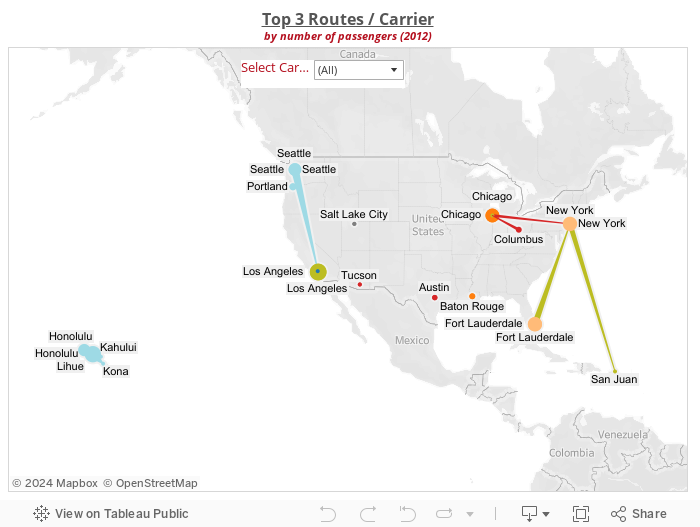 and once I saw this and with things getting cold in NY, I decided to fly to San Juan on Jetblue.. joining me?
it is fun to play around with data (data source transtats.bts.gov)
So all this looking at flight data (see below for the visual)
Which brought on new questions - So what are the top places people are flying to, what airlines fly into those places and which of the airlines are the most punctual.
once I narrowed down to an airline, I was really curious on what the top 3 routes flown by that airline was
it is fun to play around with data (data source transtats.bts.gov)
Wednesday, October 9, 2013
My 5th Grader's homework visualized
I was excited to hear that my 5th grader was going to learn how to use visual models to understand numbers and decimals. Looking at him manually go through a data table and spending minutes on each answer (and longer on some of the tricky ones), I wondered if Tableau and the power of visual analytics held true for a 5th grader.
So here is the data set -

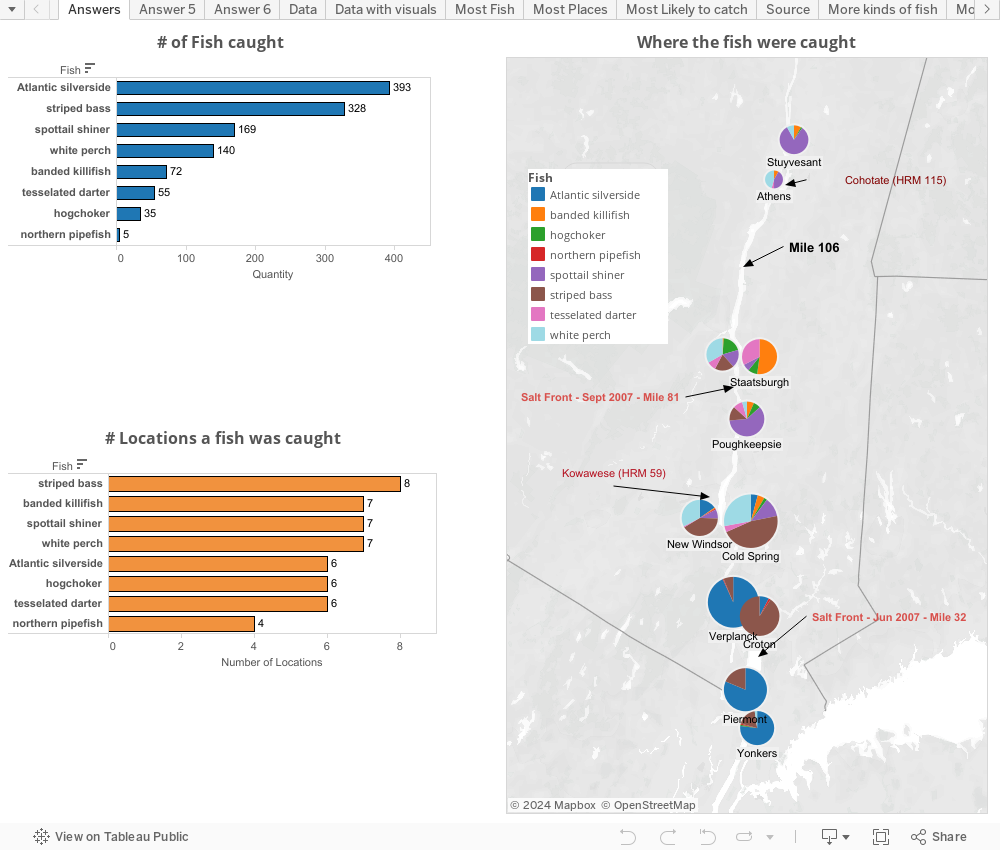
It's really a simple data set. It shows the different kind of fish caught along the Hudson and the locations of the various places they were caught and how far they are from the mouth of the Hudson.
The first thing I did was to add a little circle to the data set. The bigger the circle, means more fish were caught. Amazing how something as simple as that, immediately brings your attention to the fact that the Atlantic silverside was the most caught fish and it was in Verplanck. Our mind is immediately able to see that the circle next to 180 is bigger than the circle next to 113 (despite these being pretty small circles). If you look at the data set above, it would have taken you some time to be sure that 180 was the largest number. You would have to scan to make sure nothing was bigger. See how much time a visual cue saves?

 This is the power of visual analytics. This is the power of Tableau. A picture does speak a thousand words and it is so much more fun, easy and well worth the 15 minutes (took longer to write this blog post)
So here is the data set -

It's really a simple data set. It shows the different kind of fish caught along the Hudson and the locations of the various places they were caught and how far they are from the mouth of the Hudson.
The first thing I did was to add a little circle to the data set. The bigger the circle, means more fish were caught. Amazing how something as simple as that, immediately brings your attention to the fact that the Atlantic silverside was the most caught fish and it was in Verplanck. Our mind is immediately able to see that the circle next to 180 is bigger than the circle next to 113 (despite these being pretty small circles). If you look at the data set above, it would have taken you some time to be sure that 180 was the largest number. You would have to scan to make sure nothing was bigger. See how much time a visual cue saves?

The teacher had posed 3 questions -
1. Which was the most caught fish?
2. Which fish was caught in the most locations?
3. If I am fishing at mile 106 from source of the Hudson, what are the 4 most common fish I would catch?
So here is the challenge - Answer the 3 questions based on the data above and see how long it takes you.
Note that time down.
Now look at the dashboard I created and see how long it takes to answer the question. Click on a fish and visually see where it was caught.
Saturday, September 28, 2013
Why Tableau - The Virtuous Cycle of Visual Analytics
It's a rainy day in Seattle and decided to put my limited graphics and powerpoint skills to work in representing some thoughts.. the way I pictured it in my head was way better but my imagination is limited by my artistic abilities and converting from ppt to wmv doesn't help either..
Tableau : The Jetson Space Car of Business Intelligence
I woke up this morning and was thinking about my new job and how great it would be to have no commute. Living in NY, commute to and from work / customers, tends to be a common topic of angst and I suddenly had this revelation - commute was related to Tableau.
So here is the analogy. People (like me) living in the suburbs in NY, typically have two options -
1. Drive to work
2. Take mass transit
Let's say it's Monday morning and Joe wakes up early to get to work. Since he drives in, he knows that he has to leave the house by 7 am so he does not get stuck in traffic. Today being Monday, it is his turn to get the kids ready for school and it is raining. The kids are dragging their feet and by the time he leaves home it is 7:15. The rain does not help, there is an accident and 2 hours later he pulls into his parking spot in the city. He is tired, angry, frustrated and not in a happy spot.
Now it is Tuesday morning and Jane wakes up early to get to work. She takes mass transit. She has to be in the city for a 9 am meeting. Which means she has to catch a 7 am train. It's her turn to get the kids ready and she is able to get them out of the door. She is rushing to get to the train station and is running down the steps when the train doors close. She has to wait 20 minutes for the next train. She emails her boss that she is going to be 20 mins late. She gets to work stressed, angry and not in a happy spot.
Now imagine, that Joe or Jane had a Jetson's space car. They get the kids ready, send them off, get into a nice air conditioned space car, with an amazing view, soothing music and it gets them to work in 20 mins. Joe and Jane get to work early, are happy and enjoy getting to work.Some days they even take a few detours and stop by a few places before they get to work. Commute is fun again. Not only did it save them time, it also made the journey fun.
Now what does this have to do with Business Intelligence (BI). Well, customers that use BI tools fall into 2 buckets. Some try self service BI (drive to work) and others have experts analyzing data for them (mass transit). The issues customers face with both approaches are similar to my commute example.
Joe likes to do his own data analysis. A long time ago he gave up trying to use the complicated enterprise BI tools that his organization uses as a standard. He asks his IT guys to give him a data dump and he opens up Excel and starts analyzing data. For Joe, Excel is like driving his car to work. He can do it himself but like his commute, but he often finds himself in Excel hell. Analyzing data is really slow (like riding a bicycle) and he does get to the analysis he wants but it takes a long time. Whenever someone asks him to do something different or answer a different question, it takes forever. He is frustrated and does the bare minimum analysis needed.
Jane depends on her BI specialists to get her the reports she wants. Back in the day it was great. Like when mass transit first came to her town. There were a few people who wanted reports (train was empty), she could get her answers immediately (express train). But the last few years have been tough. More people want reports (train is crowded), she has to wait for others to get their reports before she gets hers (local train) and if she has some new questions (misses her train) she has to submit a change request (catch the next train). She gets upset at her BI specialists (train drivers) but they are not at fault (train only has so much capacity). It is too expensive to add more trains.
So Joe and Jane end up being extremely frustrated by data and analyzing it and how long it takes. So a lot of times they end up making decisions on intuition and incomplete data.
Luckily for Joe and Jane, there is a Jetson's space car when it comes to analyzing data. It is called Tableau.
Tableau has many significant advantages like the Jetson's space car -
1. It gets Joe and Jane their answers quickly (shorter commute)
2. They can use the tool themselves to get these insights without needing to bother the BI specialists (self service and the train drivers are happy there are fewer riders)
3. They can use the tool to explore the data (it is no longer about going from point A to B but you can make multiple detours along the way) and find new insights (you can see many interesting sights). Tableau lets you go on a treasure hunt through your data and most times the hidden insights are found on detours. These hidden insights are key as they are often in the blind spot of organizations and are the source of competitive advantage or risk mitigation.
4. You have an unlimited undo so you can never get lost (GPS that lets you retrace your steps)
5. Exploring data, makes people more interested in their data and no longer a drudgery (commute is more fun)
6. You don't need an expert to use Tableau and we let you take it out on a test drive by yourself (with no IT help needed).
7. You explore the data visually. It is proven that the human brain can process way more information visually than in rows and columns (like seeing the sights from your space car, rather than reading about them in a book).
8. It is cool and everyone else wants it too (just like the space car)
9. Lastly, it is actually cheaper than your current BI tools.
Before I conclude, there is one more point. There are other BI companies that claim to have the Jetson's space cars, but they approached it from just one perspective. How to shorten the commute time. So yes, they too can get you insights quickly (still not as quick as Tableau) but they need an expert to drive it. So really what they have is kind of like Elon Musk's Hyperloop. Which is great compared to your current options, but it is not a Jetson Space Car. Now, they will let you take it on a drive yourself but first they will want to know where you want to go and an expert will pre-program it. So as long as you want to go from point A to B, it will get you there faster (than your current options), but if you want to go to C or D, you will have to get an expert to re-program it.
So yes there is value in getting faster insights, but the point they miss is that it is also about the journey. Tableau makes the journey fun and fast, so you enjoy analyzing data, you feel more fulfilled and you want to explore your data. That is the key to Tableau - It is not just about the end, but about the journey. If the journey is fun, you will take it out for a spin and you will explore your data and when you do that you will find things you did not know you did not know and when that happens you can make a lot of money (identify opportunities) or save a lot of money (identify risks).
Friday, September 20, 2013
Amateur Discoveries - Wrong technology and ridicule
In my previous post about amateur discoveries I posted some examples of how a combination of Curiosity, Passion and the right Technology is all you need. Today I'd like to talk about some learnings from these amateur discoverers that I think are extremely relevant to Organizations.
Firstly, these amateur discoverers would not be able to do any of their discovery without the right technology. So it goes without saying that the wrong technology will totally destroy any curiosity and passion you have. As companies look to become more data driven and foster a data driven culture, they need to enable their people with the right tools. Traditional Business Intelligence tools are so complicated, the process to get insight so long, that people end up being scared of data and analysis. This is fixable as you can leverage technologies like Tableau that are easy to use, intuitive and visual to re-ignite and motivate your people.
The second and much more difficult barrier is ridicule / resistance from the experts. This narrative plays itself out in all organizations and I'd like to list out some examples of the difficulties our amateur discoverers faced.
When Angela Micol made a discovery using Google Earth, from her armchair, of 2 potential ancient Pyramid sites, here was a reaction from an expert - "It seems that Angela Micol is one of the so-called ‘pyridiots’ who see pyramids everywhere."
When Mary Anning started discovering dinosaur fossils, she did not always receive full credit for her scientific contributions. She wrote in a letter: "The world has used me so unkindly, I fear it has made me suspicious of everyone." It was only after her death that her contribution was recognized.
Gregor Mendel, now considered the father of modern genetics was a priest. Mendel's work was rejected and again, it was many years after his death that his Laws of Inheritance were recognized and laid the foundation for modern genetics.
On the flip side, we do have example of amateur discoverers whose works were recognized and they gained fame during their lifetimes. Examples of this are - William Herschel (discovered Uranus), Henrietta Swan (came up with the calculations that helped us figure out how far stars are), David Levy (study of comets). The learning for organizations is that if you want to establish a data driven culture, you need to provide the support and motivation for your amateur discoverers. You will have to work through the cultural resistance from experts on having to 'let go'. This is not about replacing experts but enhancing the work done by the experts. There is a value in the wisdom of the crowds and there is a force multiplier when combined with expertise.
Thursday, September 19, 2013
Iron Viz TCC13 - Why do old movies get better with age?
I was fascinated by the Iron Viz competition at TCC13 (Tableau Customer Conference). Amazing what 3 people could do in 20 minutes. It demonstrated 2 of the biggest benefits of Tableau -
1. Speed to Insight - How quickly one can get insights using the tool. Agreed these are the Iron Viz contestants and know Tableau inside out, but it still shows the power of drag and drop visualization that anyone can leverage.
2. Same data, different insights - 3 people, using the same data identified 3 totally different insights. This is the power of User Generated Analytics. Give people the right tools and the data and you will be surprised at what you discover. You will find out insights about what 'you don't know you don't know'.
This brings me to another benefit that ties in to Nate Silver's talk about biases at TCC13. Sometimes data can be misleading. I started down this path when I started looking at the visualization created by Ryan Sleeper (the winning entry).
Ryan asked a simple question based on his 20 min analysis - Do movies get better with age? If you play around with the visualization (change the age), you will see that newer movies are always showing up with a lower rating than older movies. Which makes you want to believe that the answer to the question is - Yes. If you answered Yes, then you get to Nate's theme around biases and a topic that is well expounded on by Daniel Kahneman in his book - Thinking Fast and Slow.
The beauty of Tableau is that it lets me ask questions and asking questions is key to making sure you don't misinterpret data / fall prey to biases and believe what you want to believe.
The question I wanted asnswered was - why does the data indicate that old movies get better with age?
So I downloaded the workbook and started playing around with the data. The power of collaborative analysis. I made a minor modificantion to Ryan's viz - I added the # of Ratings in addition to Average Rating (a very minor change). You can see the result here -
It becomes very clear that there are way way more ratings for newer movies than older movies and since average ratings for movies in the last 5 years is 7.5 and the number of ratings is 326K (compared to a total sample size of 449K), this is totally going to skew the results downwards.
My conclusion - New movies stand no chance.
My conclusion - New movies stand no chance.
This then leads to another follow on question - Why are older movies rated well? Not sure the data helps here but a hypothesis is that - if you are watching a movie that is 50 years old, chances are you heard good things about it and if you go to the trouble of rating it, you are going to rate it well. As far as newer movies go, you will watch a lot of good and bad movies and there are quite a few blockbusters that are pretty bad, that you will rate lower and want to make sure no one else wastes money on.
This is the other big benefit of Tableau -
3. It lets you ask questions and takes you down this journey of data exploration. It makes the exploration fun and easy. It also shows you how multiple people can analyze the same dashboard, collaborate on the answers and come up with insights that you might not have thought about.
Lastly, coming back to biases - One way to avoid biases, is to make sure you have multiple people looking at the data and allow multiple people to play with the data. User Generated Analytics = reduced bias.
Curiosity + Technology + Passion = Amateur Discoveries
In his TCC13 Keynote Christian Chabot did an awesome job talking about how the great discoverers are jazz artists. They were able to combine logic with intuition and discover insights that changed the world.
While we are indebted to these geniuses for their contributions, there are examples of amateurs who have leveraged technology, curiosity and passion to make significant discoveries too.
Angela Micol, an armchair archaeologist using Google Maps has potentially discovered 2 lost Egyptian Pyramid complexes.
Donald Harden, a California school teacher deciphered the Zodiac Killer's message (a 408 symbol cryptogram) over a weekend.
Mary Anning, made a number of important dinosaur fossil finds and changed our understanding of the history of the earth. She started out collecting sea shells.
Nate Silver, proved all the political pundits wrong by exactly predicting the 2012 elections.
William Herschel, a musician, dabbled in astronomy and discovered Uranus with a telescope he built himself. Astronomy is one field where you keep hearing about amateur discoveries. With the right technology, anyone with passion and curiosity can be an expert.
The point here is that every organization has an Angela Micol, a William Herschel or a Nate Silver. These are people that are curious and passionate about data discovery, but sadly their organizations do not provide them with the right technologies. The technologies they have access to, tend to be so complex and time consuming that they actually sap the passion and curiosity out of the employees. So much so that they end up getting frustrated with data.
Imagine if you could provide your people with a business intelligence tool that is simple and intuitive that anyone can learn quickly. A tool that makes your data come to life. A tool that your people can use to play with the data. A tool that helps your data tell a story. A tool that reignites that passion and curiosity in your people. A tool that can help your people see and understand data. That is the power of Tableau.
Sunday, September 15, 2013
TCC13 Keynote Infographic
Finished watching the TCC13 Keynote recording a couple days ago and wanted to create an infographic depicting the key messages. For those who missed the keynote / want to know what everyone is talking about, but don't have 90 mins to watch the recording this is my interpretation.
.jpg)
.jpg)
Subscribe to:
Posts (Atom)